Does Story Counting work?

Introduction
Allen Holub says that we can predict a release date without estimations using Story Counting. Check out his #NoEstimates video on youtube.
Story Counting sounds like a dream to me. No more countless meetings where you argue is that 2 or 3 story points story.
Let’s check if story counting works. I have historical data from one of my projects. I will try to predict the release date and then compare it with the real one.
A brief introduction to Story Counting
Allen explains Story Counting very well in the #NoEstimates video. If you don’t want to spend 38 minutes, read at least a brief explanation from this section.
Step 1
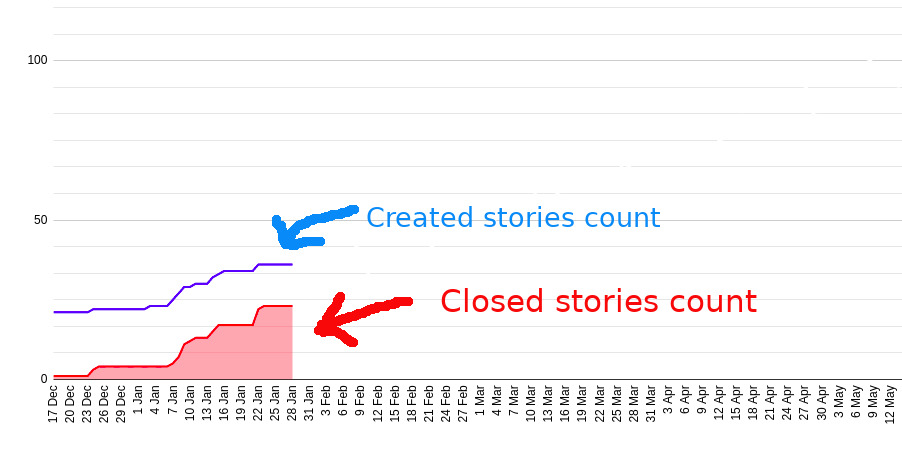
Build a cumulative flow diagram to predict the release date. The X-axis is time, the Y-axis is stories count. Put two points every day: one for created and one for closed stories count.
Step 2
Build a trend for created and closed stories count. The trend shows our progress if we continue to work at the average tempo.
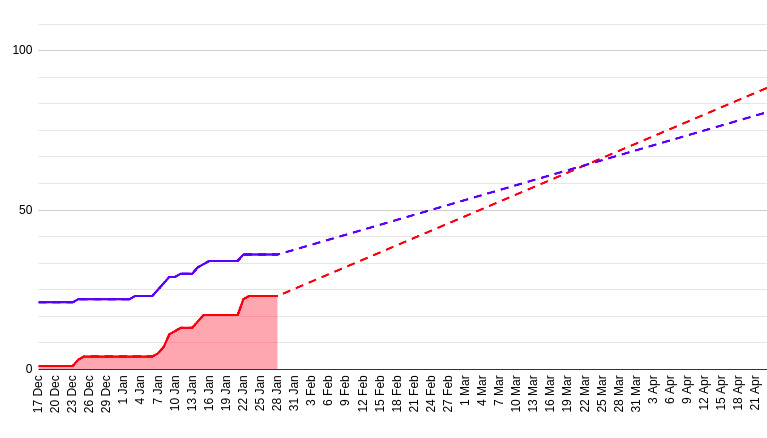
To build a trend, calculate an average velocity per day.
average close velocity = (count of closed stories in the last 14 days) / 14.
Closed stories count is increasing every day by average day velocity.
Add velocity every day to the last known value.
next day = previous day + average velocity.
Repeat the same for created stories count.
Step 3
Predict the release date. Created and closed stories trends meet at the predicted release date.
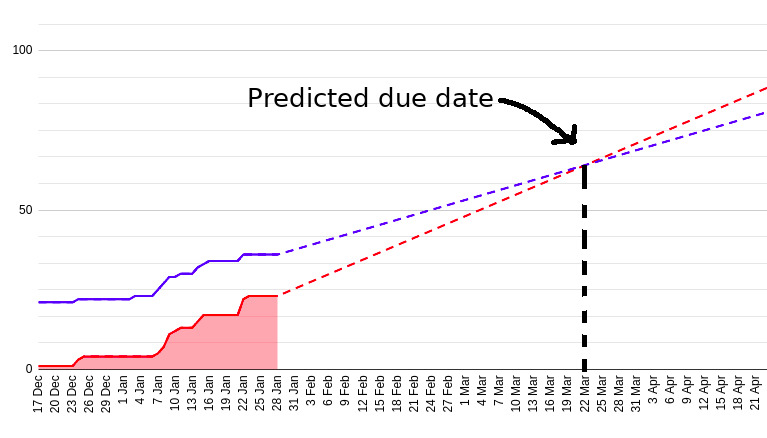
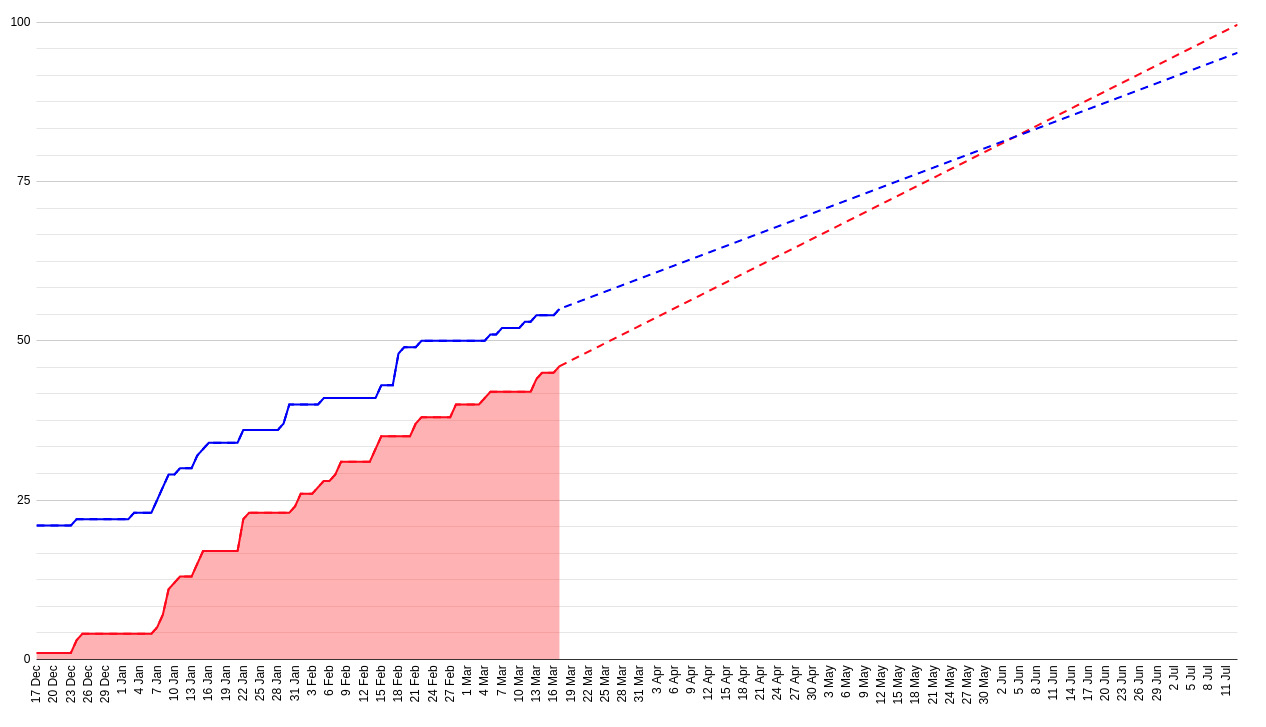
Here’s the prediction after the 6 weeks of development. It says March 22.
Dictionary
Let’s refresh and align our dictionary. I use the following terms in the article.
User story - describes one feature. It’s like a task for one developer. Cards that you move in Jira from “In progress” to “Closed” in most cases are user stories.
Epic - a bunch of user stories related to the same piece of functionality. Some features are too big, for example, “Sign in”. It can be split into many user stories like: “As a user, I want to sign in using email and password”, “As a user, I want to sign in using Google account”, etc.
Epics are handy if you aren’t sure how exactly to implement the feature. You know that you need “Sign in” feature, but you don’t know all the details. Discuss features with your team. During the discussion, you will realize that “Sign in” requires: “Password complexity validation”, “Sign in via Google”, “Forget password”. So you create a new user story for each discovered piece of functionality.
Story of one release
The beginning
In the beginning, we had many high-level stories like “Sign in”, “Search”, etc. Usually, they’re called epics. But we created them as stories in Jira, which means I counted them on the graphs.
We had many meetings to discover and create new stories for the epics. PO asked developers “What do we need to implement sign-in?”. Developers were telling details of implementation: “We need to integrate Google SDK to provide google sign-in”. PO created new stories for the discovered details.
2 weeks of development
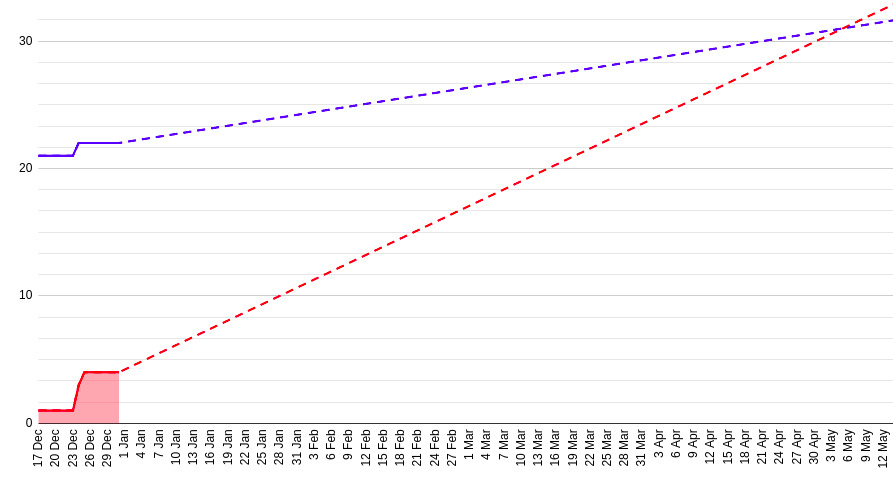
After 2 weeks of work, we got at least some historical data. Trends predicted release date on May 4.
6 weeks of development
After 6 weeks of work, the release date came closer. Trends predicted release date on March 22.

12 weeks of development
We created more and more stories as we went. After 12 weeks predicted release date became June 5.
18 weeks of development
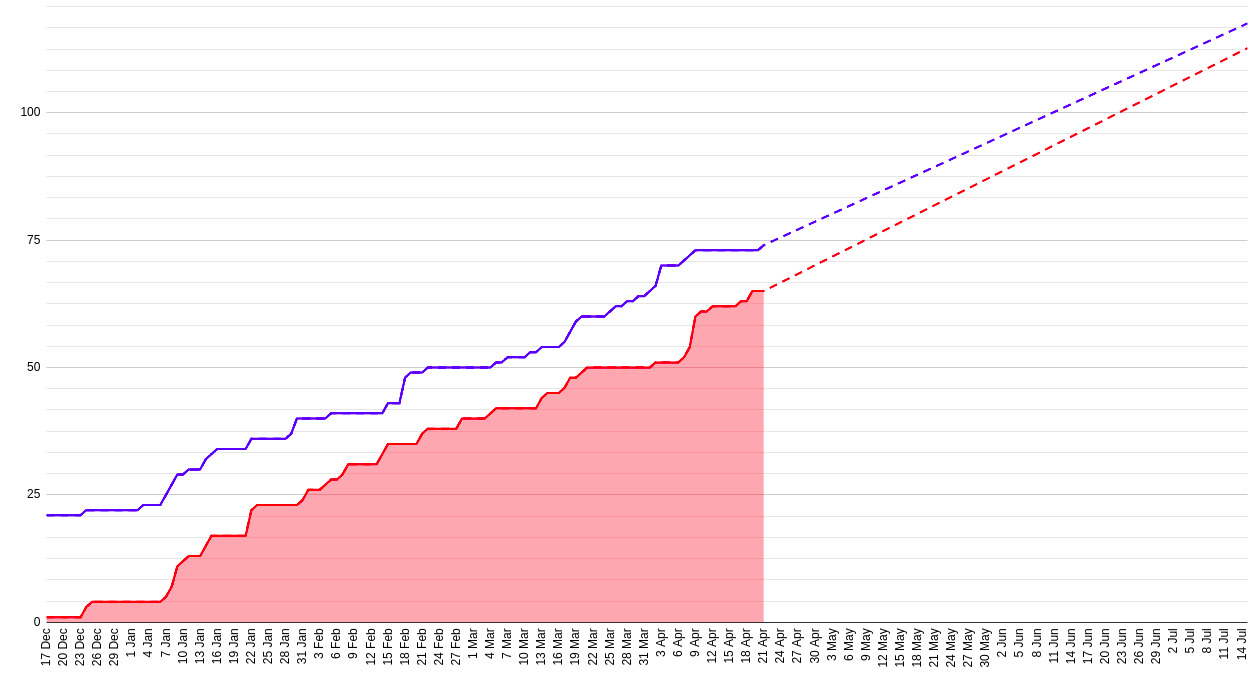
In week 18 created stories trend is almost parallel to the closed stories trend. No release date prediction this time. We won’t ever release the app if we continue adding so many stories.
Release
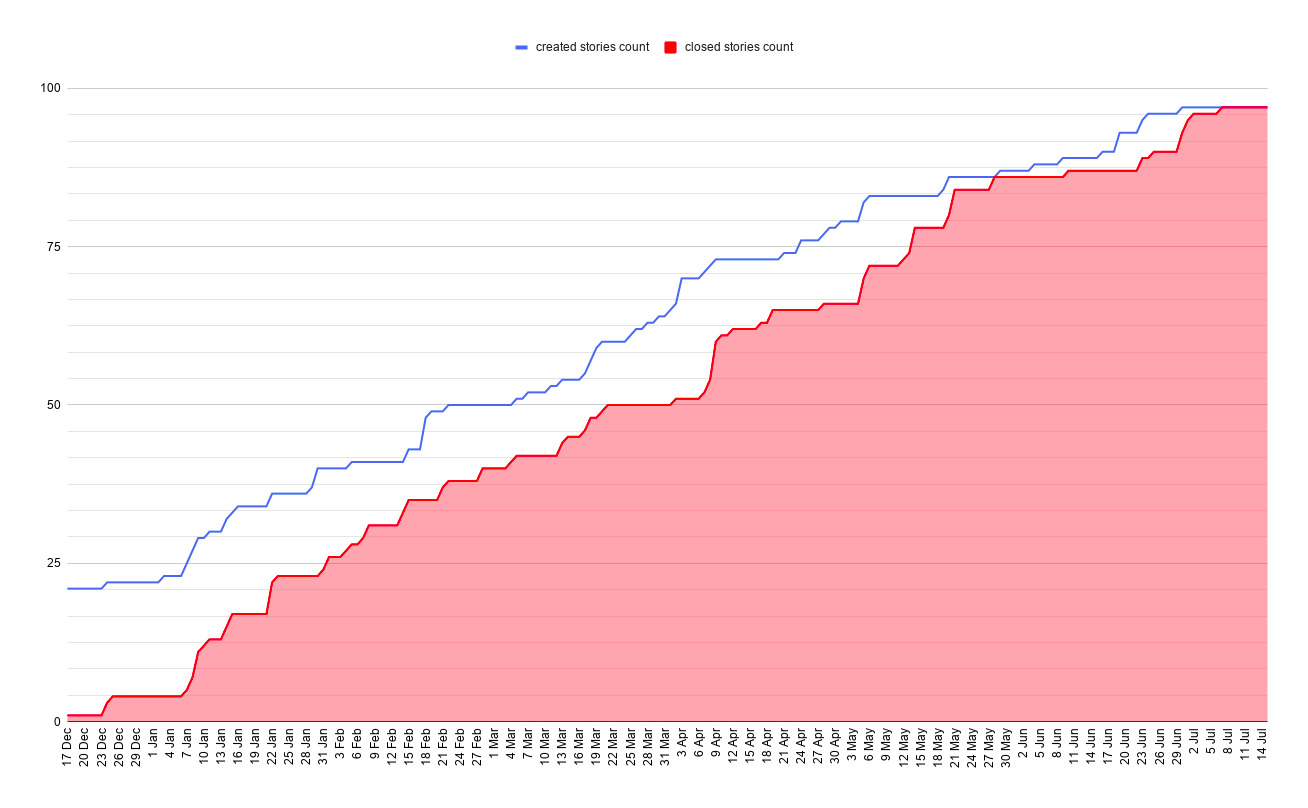
We released the app on July 7. At some point, PO just stopped adding new user stories. All epics were split into stories and clarified.
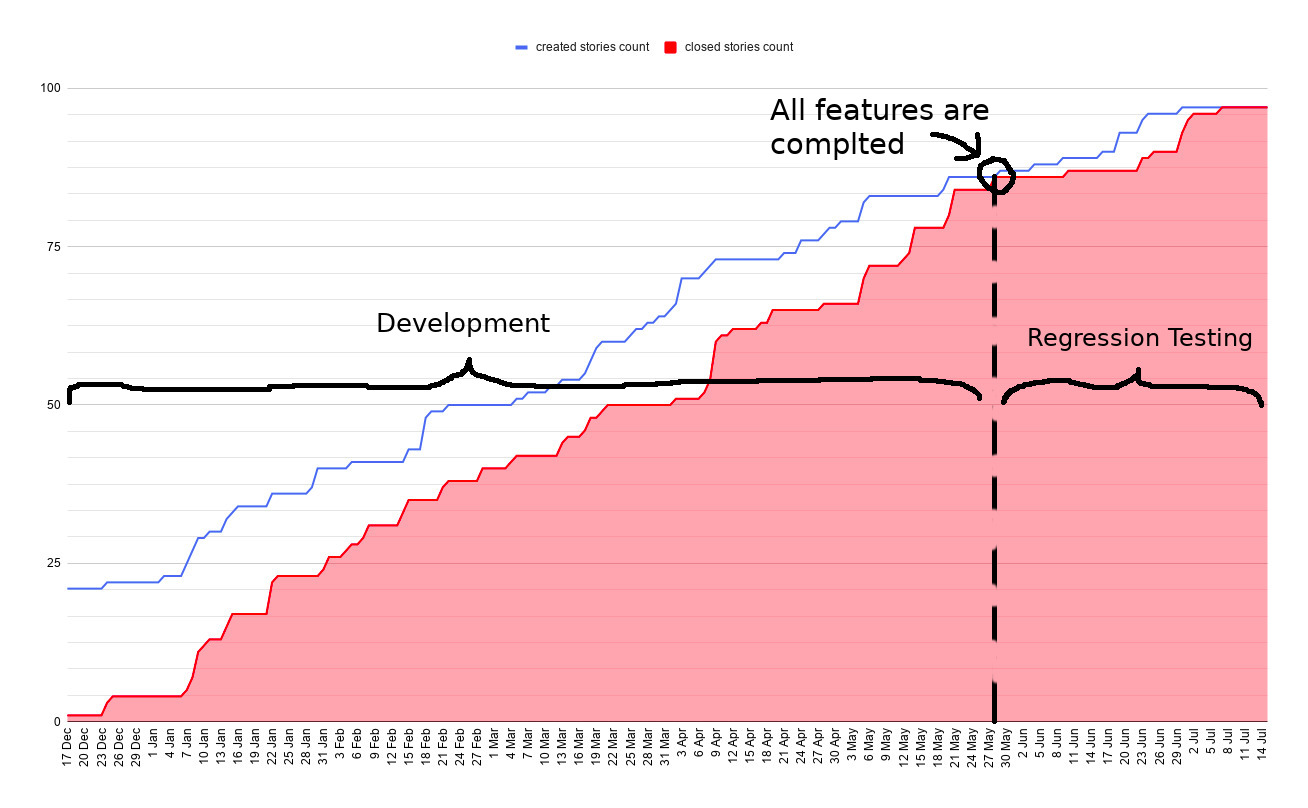
All features were completed on May 28. Then we had our first and long regression. It took 40 days.
Prediction vs Reality
| Weeks of development | Predicted Release Date |
|---|---|
| 2 | May 4 |
| 6 | March 22 |
| 12 | June 5 |
| 18 | Unknown |
| All features are completed | May 28 |
| App tested and released | July 7 |
Analysis of results
In my case created stories count trend was parallel to closed stories count trend. At some point in time, we had just stopped adding more stories and released the app.
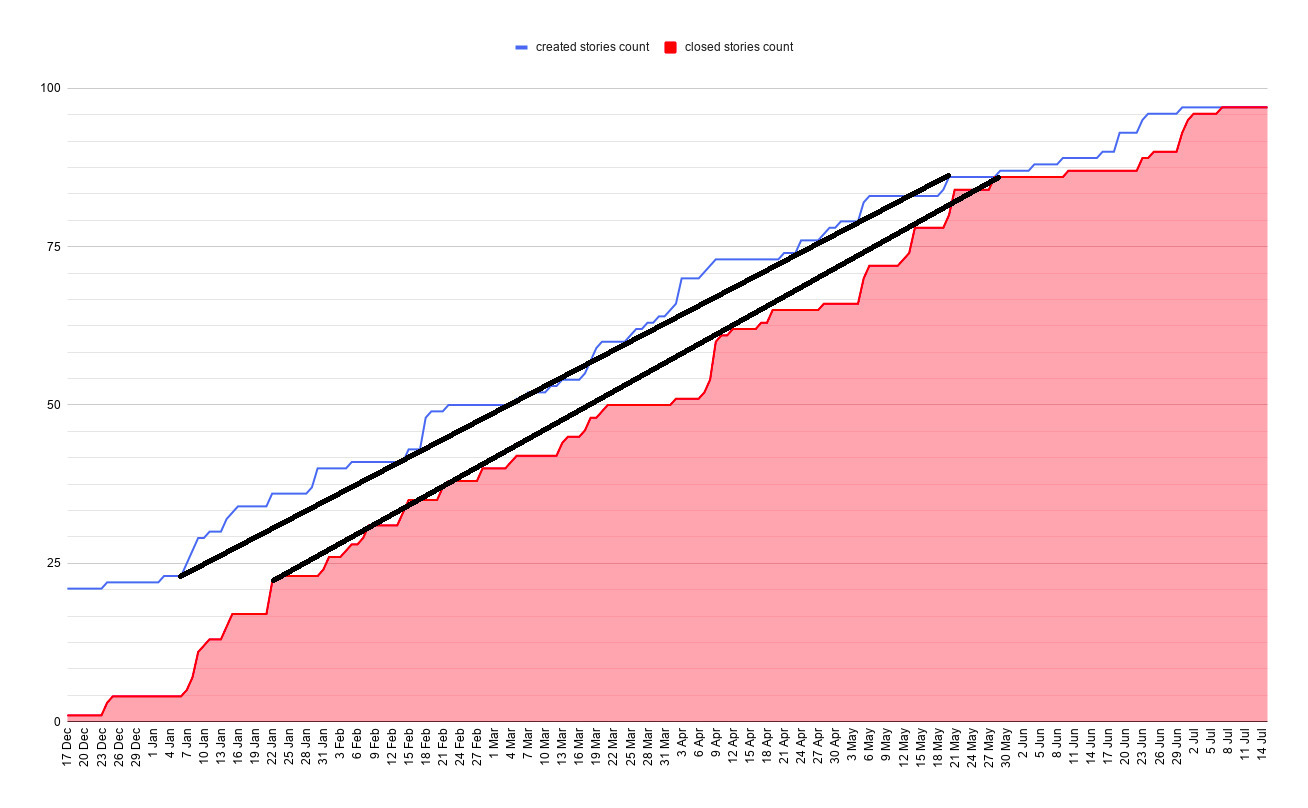
Story counting failed to predict user stories count. Imagine a team where developers close stories faster than PO creates them. When the team closes all stories, a release doesn’t happen. We release the app when all the functionality of MVP is ready. I.e. we need to close all epics.
But closed stories count is linear. It should be predictable.
What if all stories were created in advance
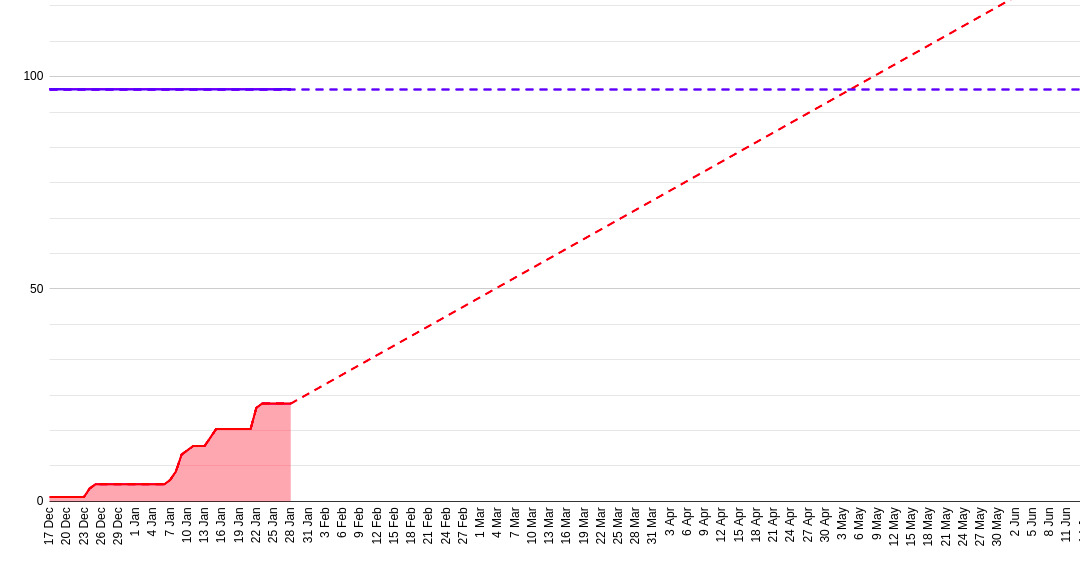
We could have spent more time discovering and splitting down epics in the beginning of the project. Would it help us to get a better prediction? Let’s try to predict the release date using the final number of stories - 97.
On the diagram created stories count became parallel to X-axis.
| Weeks of development | Predicted Release Date | Diff with reality* |
|---|---|---|
| 2 | Unknown | Unknown |
| 6 | May 3 | 32% |
| 12 | July 5 | 1% |
| 18 | June 17 | 10% |
| Actual date | July 7 |
* How far the predicted release date is from the actual date with respect to release length.
diff = (Diff in days * 100%) / release duration in days.
Story Points vs Story Counting
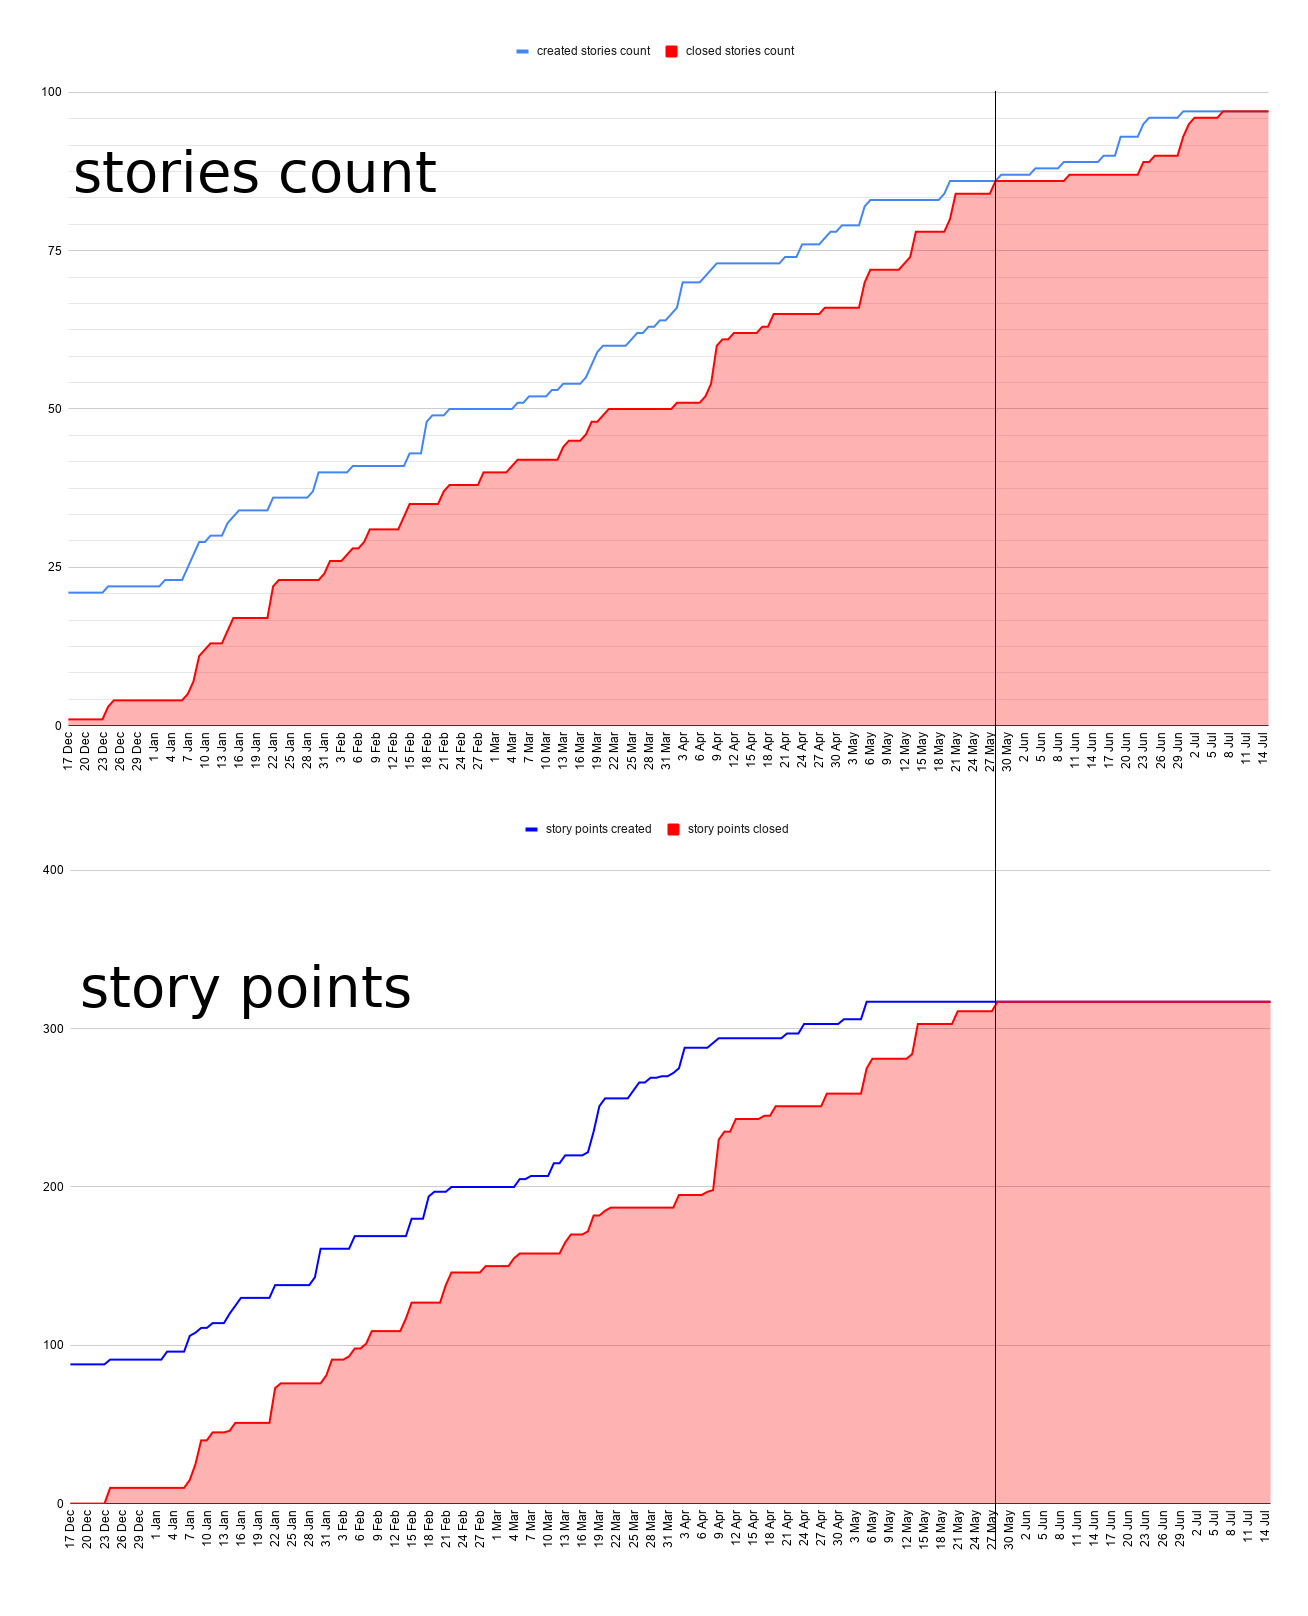
The team’s velocity is equally linear for both approaches. If you believe in story points-based burndown predictions, you can believe in story counting as well.
Summary
Story Counting isn’t a silver bullet. It won’t help you if you don’t invest time in discovery and requirements clarification in the beginning. The more stories you create at the beginning, the more accurate due date you get. A prediction can’t be more accurate than the plan. Vague plan - vague predicted release date.